Since there are no more problems than solutions, improving your problem-solving techniques is an essential ability as a business owner. Whenever your business runs up in a problem, by implementing certain techniques you are more likely to quickly overcome the challenge you are facing.
Instead of thinking through an imaginary challenge, it is always better to visualize it. As a problem-solving method that represents the issue visually, flowcharts are used by many firms and individuals.
To help you find a way in solving complex problems using visual methods, we made this article. In addition, you will learn what flowcharts are, and some tips that will help in creating them for better results.
Why Should You Consider Visual Problem-solving Methods

When you have to think of a solution to a problem that is only verbal, everything becomes more complicated. For that reason, people have found techniques where the problems get introduced into a paper for visual reasons. With the help of bubbles and arrows, we show the whole solving process.
With that, we get to define the issue, we get to think of possible solutions and outcomes. The smartest solution is selected and implemented and the results can be easily analyzed.
Although writing may be convenient for you, it may seem chaotic and complicated to the team you are working with. For that reason, diagrams and flowcharts are the solutions for addressing problems visually and coming up with the smartest solutions.
Explanation of Flowcharts
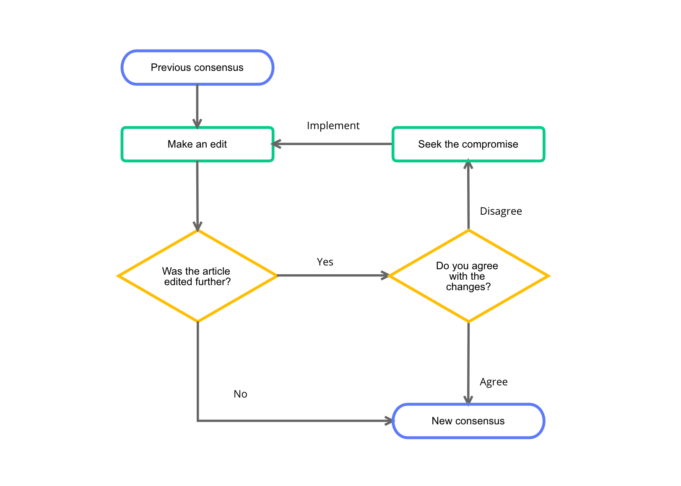
Flowcharts are types of diagrams that are meant to show the whole process of the problem-solving activity. With the usage of bubbles and arrows, every step is connected to another, which makes the whole topic easier to be understood.
Besides bubbles, the flowchart can consist of circles and ovals as well as squares and rectangles. These symbols are important for sorting the chart and making everything clearer.
Tips to Come Up With Better Flowcharts
Because the flowcharts are a very versatile visual method, it might be hard for you to adapt to them at first. However, you will surely learn how to effectively use them after a short time of using them.
To help you in creating efficient flowcharts, we prepared a couple of tips that will surely help in solving complex problems. If you need more information or further guidance in preparing quality charts, many sites like knowtechie.com offer such content.
Use a Format You Are Comfortable With

When creating a flowchart, there are various templates that you can use. However, for more efficient work, it is better to stick with one format. By being consistent, distractions will be minimized, which significantly speeds up the process.
If you do everything by yourself, there are a couple of so-called rules that you should follow. The shapes of the boxes have to be used properly. For example, every chart has a beginning and an end. That is why they should be made with a different shape than the elements in between.
In addition, colors can be used to differentiate certain steps in the flowchart. Do not be afraid to use them, even if they only hold an aesthetic value. When it comes to the spacing between each box, make sure they are equal. Many people get distracted by the difference in spacing which can slow the solving process down.
Lastly, you should know that the boxes are not only for words. In some situations, images can be a better tool to explain the process. Besides explanation, they make the chart more dynamic, which only helps in the visual presentation of the problem.
Be Sure to Do It on One Page
Keeping your chart on a single page is essential for the readability of the process. For that reason, you should ensure you optimize the chart whether in multiple columns or separating the process in multiple charts. Keep in mind that you can connect every chart with a hyperlink that will help in quick access.
In case the chart is slightly bigger than a page, you can simply make the chart smaller to fit. However, you need to understand that the size of the letters will also be resized. For that reason, before you save the progress, ensure readability.
Another way to keep everything contained on a single page is by creating the steps from left to right. That will help in squeezing in more steps, which will surely help in understanding the complexity of the problem you are facing.
Lastly, you can divide each step into a separate flowchart. That way, you can use hyperlinks if you need further information. By keeping the main chart, you will have a clearer image of the process, as well as quick access to the other smaller charts you have created.
Follow Right Directions

As mentioned above, the flowchart has to be made in a way to is visually appealing, but also functional. Since we are all reading with the direction from left to right, those are the principal when creating your flowcharts.
Prioritize the Split Path
Coming up with diagrams that have the traditional structure where a rhomboid or a diamond is placed in the middle as a decision symbol has many drawbacks. It firstly breaks the reading directions since it has arrows pointing up and down.
Most people are unfamiliar with the implementation purposes of each symbol. That way, they will use the diamond incorrectly which leads to confusion. On the other hand, even with the correct placement of the diamond, people that do not know the meaning of the shape will get confused.
To avoid all of these issues, it is best to prioritize the split path. That way, you ensure the easiness of the flowchart without the need for further explanation.
Implement Return Arrows at the Bottom Portions of the Chart
The normal reading process is coming from the top of the page down. Because of that, the return arrows should be placed at the lower portions of the flowchart. In addition, you should be careful and prevent overlapping of the arrows since it can make interpreting the processes confusing.
Things to Consider When Looking for a Flowchart Tool

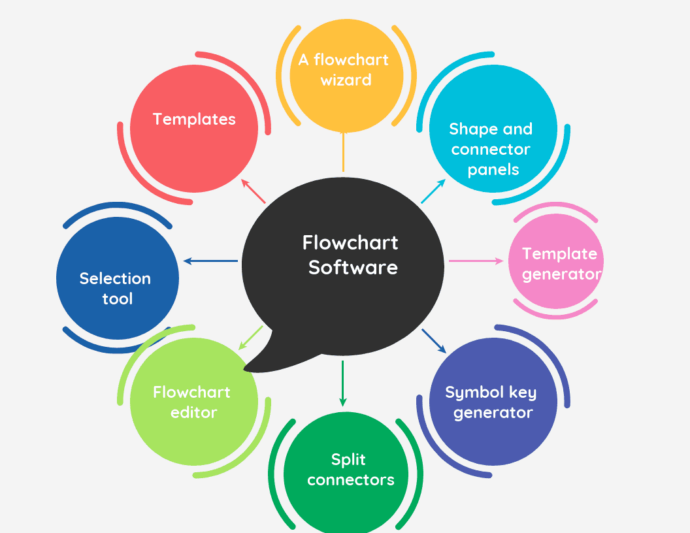
With various flowchart tools, you might have an issue with selecting the right one. Although most of the apps work the same, there are still a couple of things you need to look for before you select the one you’ll use.
The first thing is the interface. It needs to be clear and easy to understand. Various templates and symbols are also beneficial since you can explain the process better.
In addition, it has to have a feature to easily share the content with colleagues and clients that can further modify the flowchart. This helps in many remote workplaces and gets more people on the case which surely helps in solving complex problems.


